Octopus can be configured to log HTTP requests to text files, which can be very useful for analyzing usage patterns and detecting performance problems. By default, web request logging is turned off. This page explains how to turn the feature on, as well as the format of the logs.
Log file format and retention
Octopus web request logging uses the W3C extended log file format, the same format that IIS uses. This means that tools which normally work with IIS logs should also be able to work with Octopus logs.
The fields that Octopus logs for each request cannot currently be changed. It will log the URL path, the username of the user making the request, the status code, and the time the request took, which should cover most usage scenarios. Here is an example log file:
#Software: Octopus Deploy 1.0.0.0
#Version: 1.0
#Date: 2015-08-10 00:25:21
#Fields: date time cs-method cs-uri-stem s-port cs-username c-ip sc-status time-taken
2015-08-10	00:25:21	GET	/api/dashboard	8065	-		::1	503	46
2015-08-10	00:25:22	GET	/api			8065	admin	::1	200	365
2015-08-10	00:25:23	GET	/api/users/me	8065	admin	::1	200	67
Octopus writes to a new log file each day, and keeps up to 7 files. Older logs are automatically deleted.
Configuring web request logging
Web request logging can be enabled or disabled from the command line, using Octopus.Server.exe. A restart of the Octopus Server is required for the setting to take effect.
Octopus.Server.exe configure --requestLoggingEnabled=true
Octopus.Server.exe service --stop --start
Use the logs
Since Octopus uses the same log file format that IIS uses, tools that work with IIS logs will also work with Octopus web request logs, including:
Different tools have different uses - WebLogExpert and AWStats can be used to build friendly HTML reports of usage which you can explore. Tools like Splunk can be used to monitor the logs in real time, look for outliers, and configure alerts.
For exploratory analysis of the logs to look for performance issues or trends, the simplest way to consume the log files is with the free Log Parser Studio from Microsoft. It builds on top of the command-line LogParser tool, and lets you perform SQL-like queries over the log data.
- Download and extract Log Parser Studio.
- Run LPS.exe to open the UI.
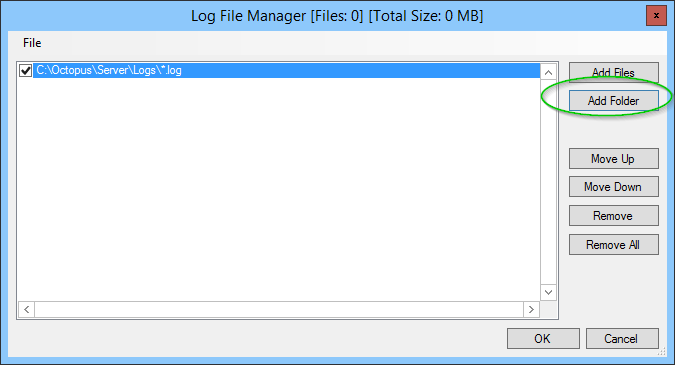
- Click the button to configure the logs folder to look at.

- By default, Octopus logs are written to
C:\Octopus\Server\Logs\, and have the*.logextension.

- The Library tab shows a list of sample scripts that will help you get started. Scroll down to the IIS section - these queries are a good starting point:

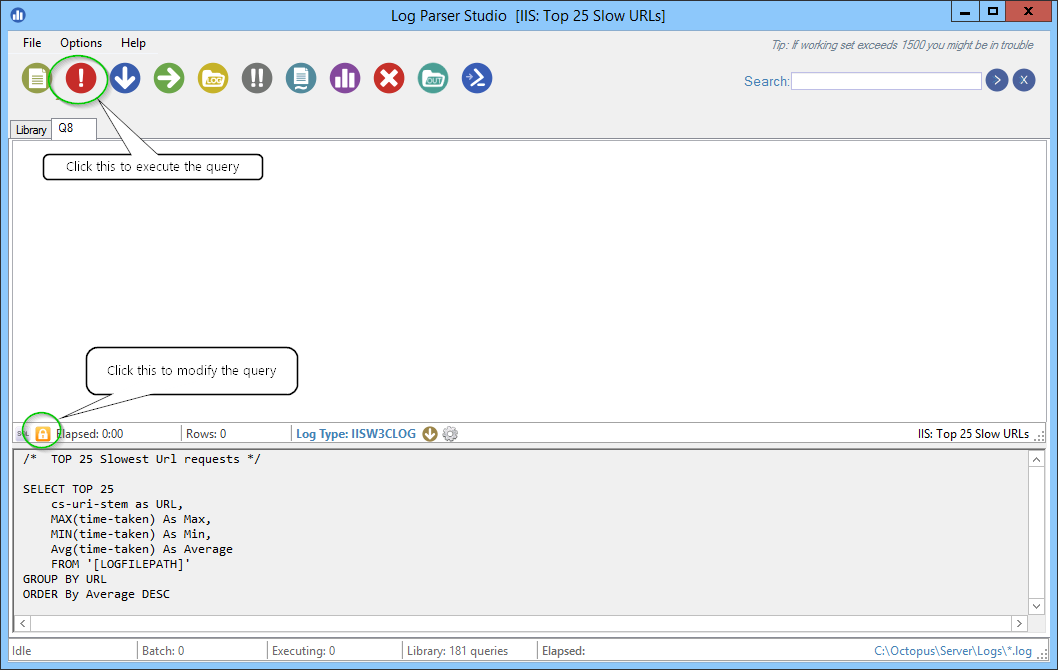
- Double-click a view to open it, for example, the IIS: Top 25 Slow URLs view. You can then modify the query, or simply execute it.

- Executing the query will display the results in a grid:

Help us continuously improve
Please let us know if you have any feedback about this page.
Page updated on Sunday, January 1, 2023